
![]()
Visme is a great tool that allows you to create online presentations and Infographic with ease (even if you’re not a graphic designer). Visme has over 300,000 users and is one of the leading online presentation tools.
Visme also allows you to easily make graphs and charts of your data (e.g spreadsheet) for your presentation or infographic.
It’s also a great alternative to Microsoft Powerpoint (Visme has more features) and has tons of templates for presentations and infographics for you to use.
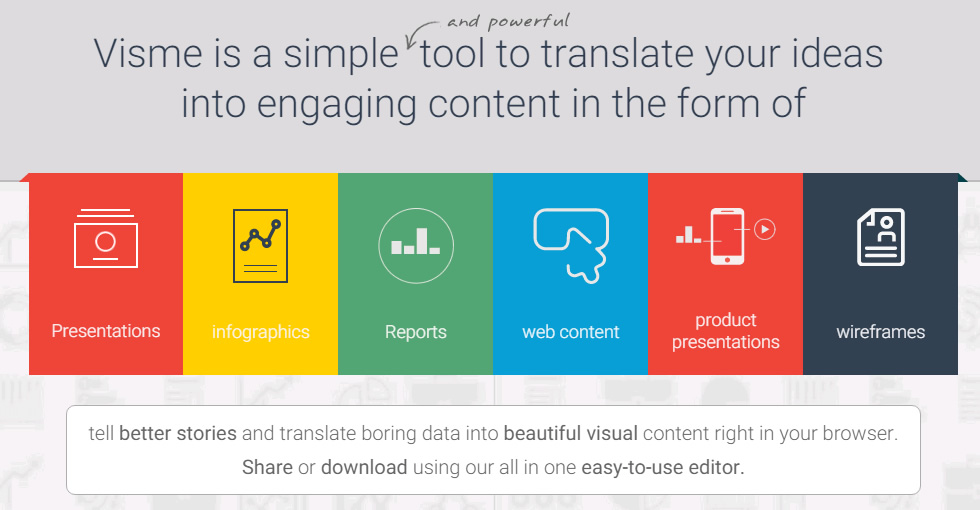
Now let’s find out how to create visually stunning presentations and infographics with Visme (it’s very easy!).
Create a Presentation
To start things off, we are going to create a presentation with Visme.
First, Login into your Visme account (or register an account if don’t have one)
After you’re in your Visme account/dashboard, click on the “Create New Visme” button.
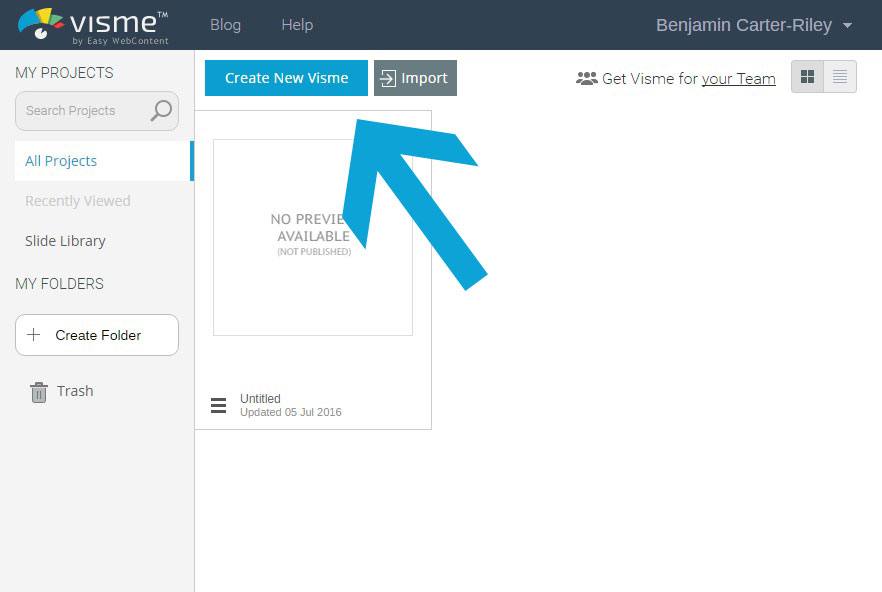
Then you’ll be prompted with a pop-up to name your Visme project (name it so it describes your project).
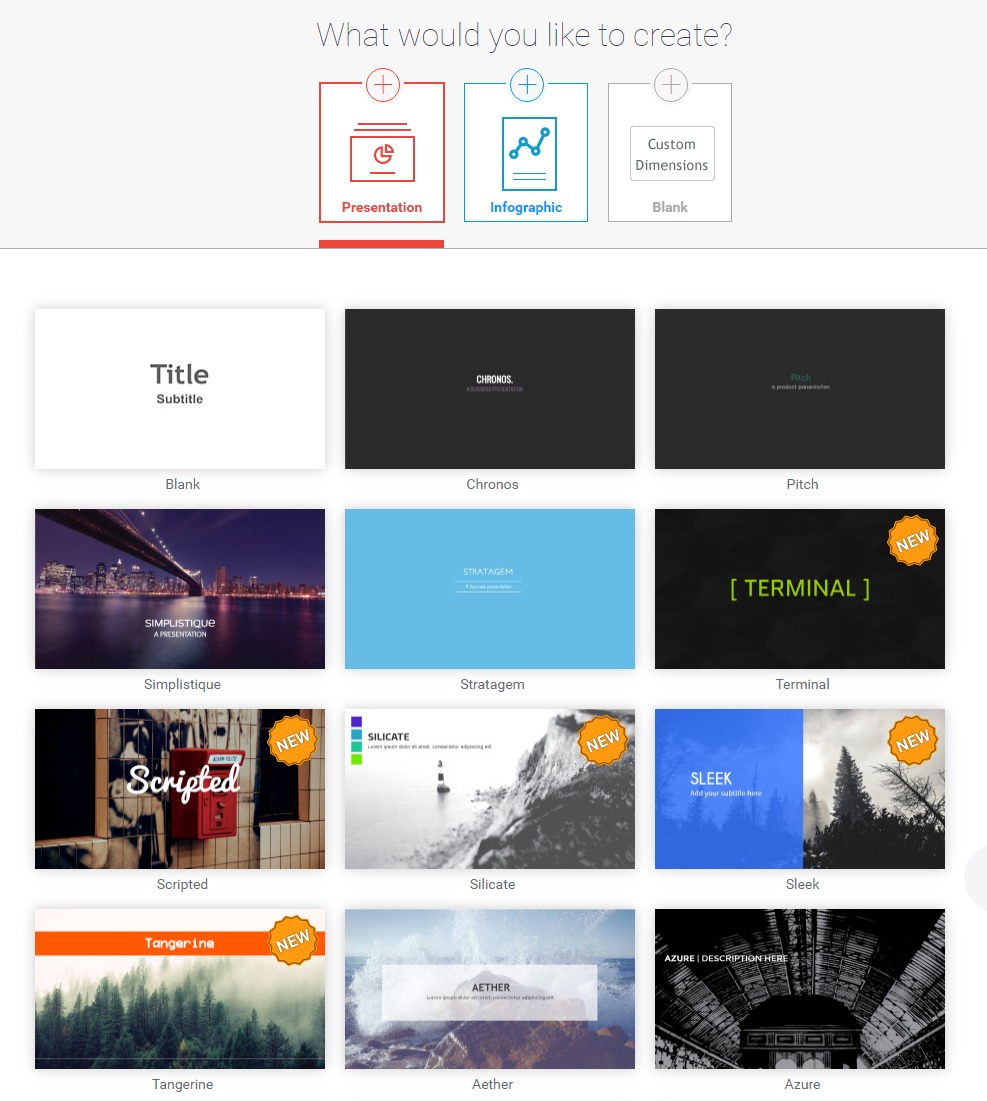
Now you’ll have the option to make a Presentation, Infographic, or Blank Project. For now, we will select the Presentation option.
Pick any template of your choice.
After you’ve chosen your template, you will be able to edit and tweak it.
Visme comes with templates that you can simply drag-and-drop into your projects workspace, let’s drag one of them into our presentation.
After you’ve dropped your object into the work space, you can use the text toolbar to edit your text to your liking.
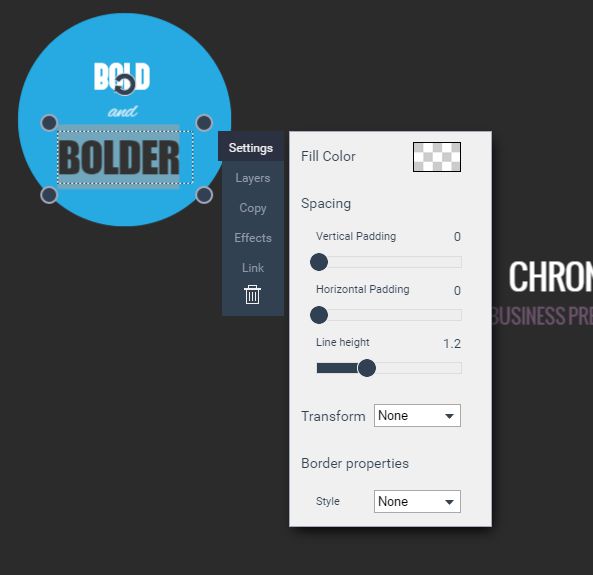
You’ll also find a toolbar on your left, with more settings/features for your online presentation.
- Background – Change background of project work space
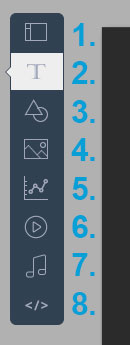
- Text – Add text your presentation
- Shapes & Icons – Add visual content with the large amount of shape & icons to choose from
- Images – Select from over 1700 free images or upload your own pictures
- Charts and Data Widgets – Quickly create Graphs and charts with your gathered data
- Video – Add video content to your project with a YouTube or Vimeo link
- Audio – Add music to your project with Visme’s sound library, record audio (in Visme), or upload an audio file from your device.
- Embed External Content – Insert iFrame Content into your presentation
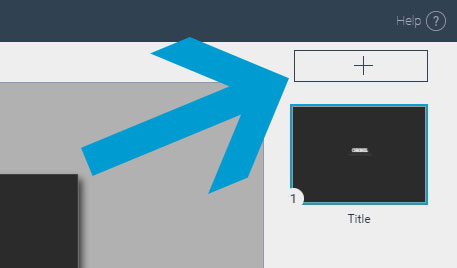
Add a New Slide
After you have finished adding content to your first slide, then you can add a new slide to your presentation, by clicking the “+” button on the right.
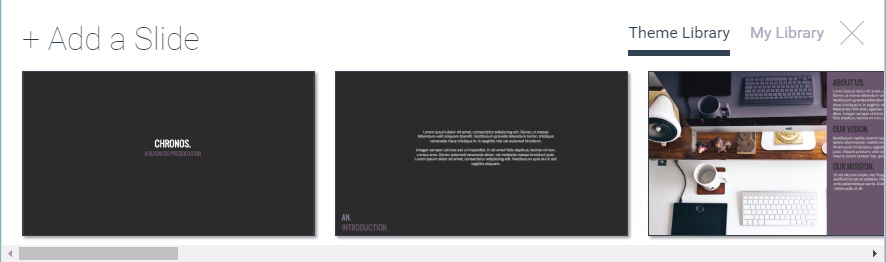
Then pick a new slide from one of the options available.
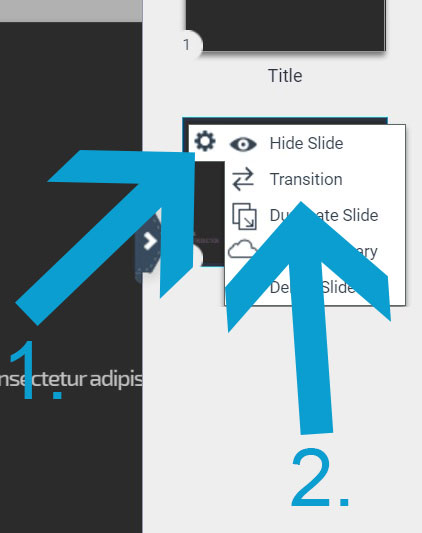
- After you have added your slide, you can then apply a transition effect by clicking the gear icon on one of the slides (you must mouse over it first).
- Then click transition to apply a transition effect.
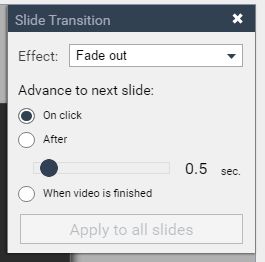
From there you will be able to adjust your slide transition setting to your liking. You can choose from 5 effects, and you can also choose how to advance to the next slide.
Publish/Preview Your Presentation
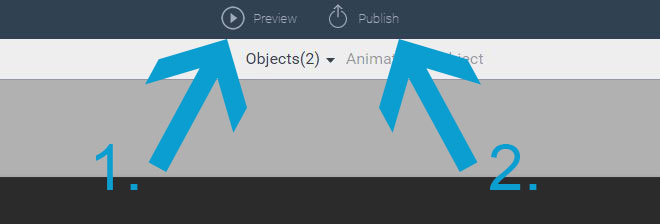
- After you have added content to your slide(s), you might want to see what they may look like as a presentation. To do this, click on the “Preview” button.
- After you have finished creating your presentation, click the “Publish” button
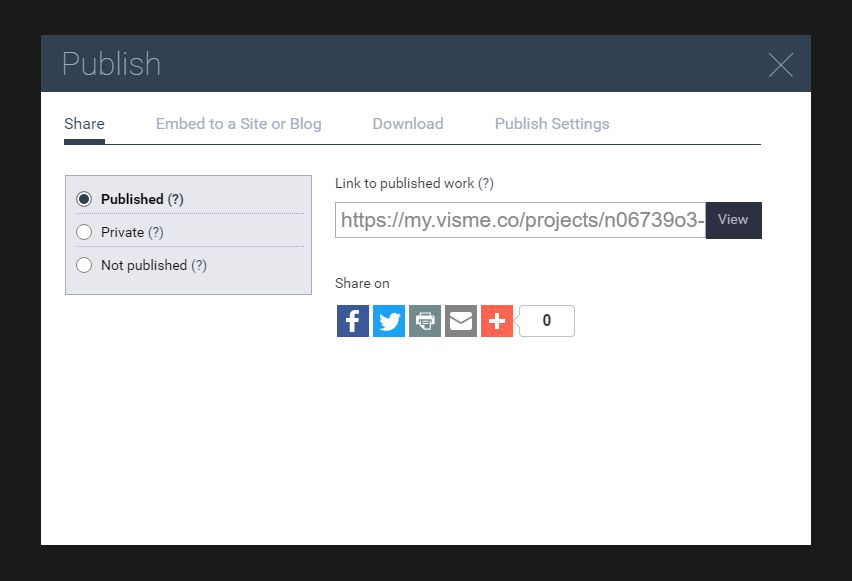
After hitting the publish button, you will then see a window giving you options to share/publish your presentation.
- Share – Get a link to your presentation, or share it via social media.
- Embed to a Site or Blog – Embed your presentation into your site or blog with HTML code.
- Download – Download your presentation with the following file formats: PNG, JPG, PDF, & HTML5.
- Publish Settings – Allows you to tweak additional settings such as: Social, Audio, Playback, & Design.
After that, you have successfully created a Visme Presentation! Well done.
Now let’s find out how to create an Infographic with Visme (similar process).
Create an Infographic
Once you’re in your Visme dashboard click the “Create New Visme” button to create your Visme Infographic.
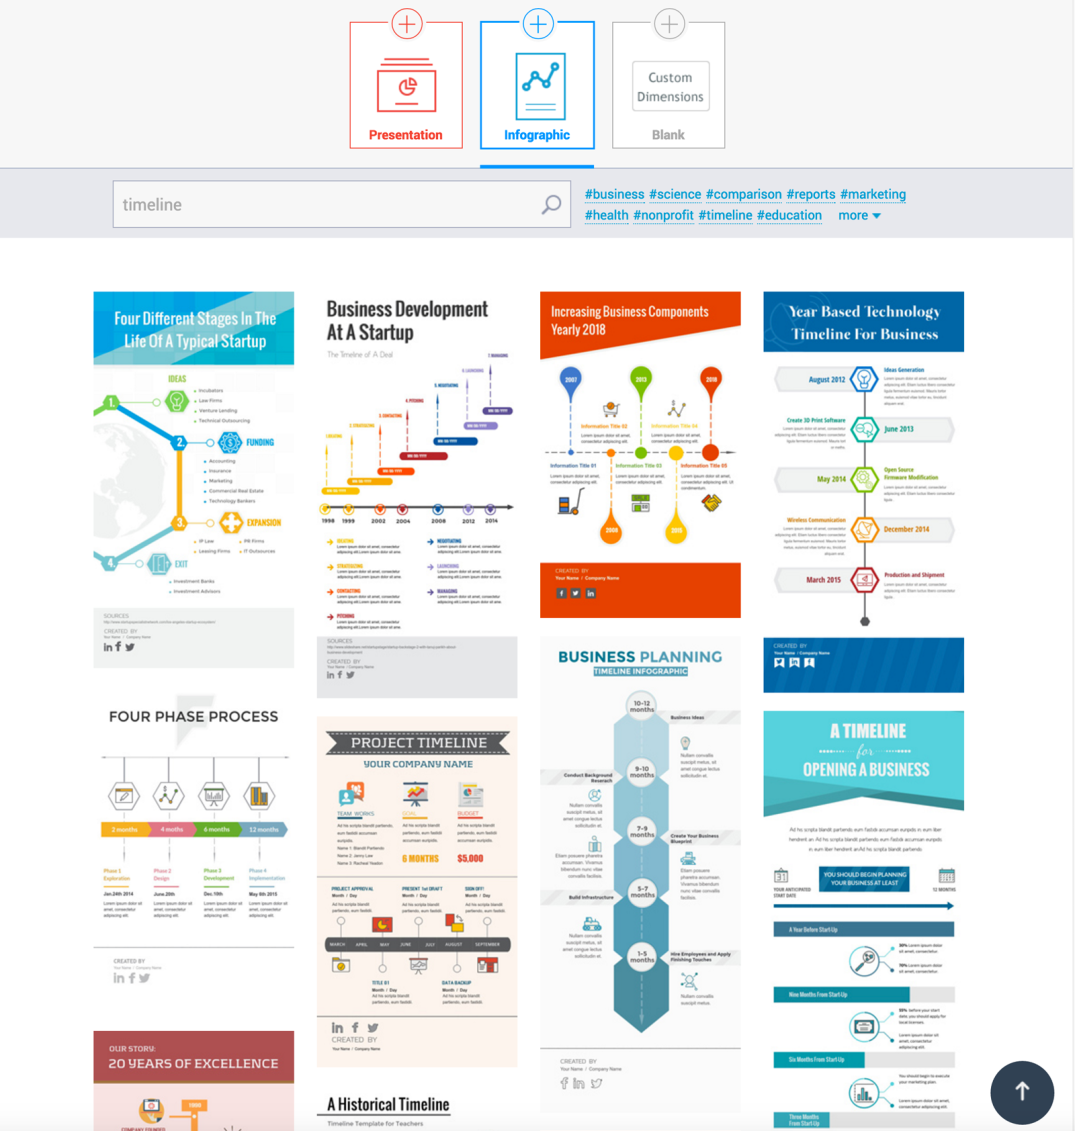
You will then see a list of Infographic templates for you to choose from. Select your favorite template to continue.

Once you’ve chosen your Infographic template, you will then see your project workspace that will allow you edit your Visme Infographic.
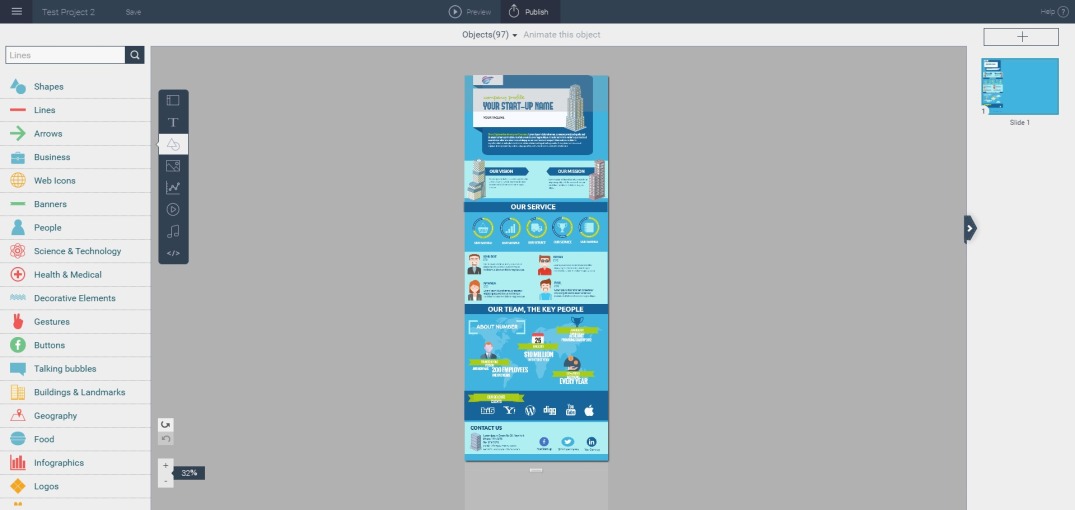
You can extend the length of your infographic by dragging the slider at the bottom of your infographic.
Like with Visme presentations, you can also drag-and-drop objects, text and more into your infographic.
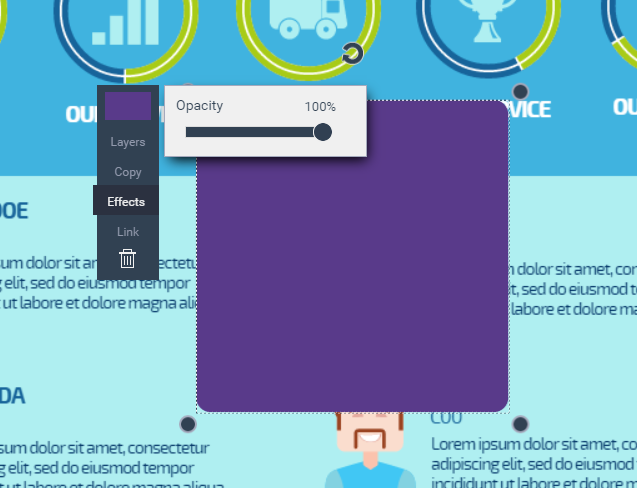
You can also edit the objects properties with the toolbar once the object is selected.
If you look to the left of your project, you’ll see a toolbar with additional options being:
- Background – Change background of project workspace
- Text – Add text your presentation
- Shapes & Icons – Add visual content with the large amount of shape & icons to choose from
- Images – Select from over 1700 free images or upload your own pictures
- Charts and Data Widgets – Quickly create Graphs and charts with your gathered data
- Video – Add video content to your project with a YouTube or Vimeo link
- Audio – Add music to your project with Visme’s sound library, record audio (in Visme), or upload an audio file from your device.
- Embed External Content – Insert iFrame Content into your presentation
Publish/Preview Your Infographic
- If you want to get a preview of your infographic, you can do so by clicking the “Preview” button as shown.
- Once you’ve finished your project, hit the “Publish” button te receive you finalized infographic for you to share.
- Share – When publishing your infographic, you can share via social media straight away (or grab a link)!
- Embed – You can also embed your infographic directly into your blog post with HTML codes.
- Download – Or you can download your infographic to your device (as PNG, JPG, PDF, HTML5)
- Publish Settings – You can change your publishing settings before publishing your infographic (Social, Audio, Playback, & Design).
After you have published your infographic, then congratulations, you have successfully created your infographic with Visme!
Features
Now that you’ve created and finished a Visme Project, let’s see some of the features that Visme has to offer for creating amazing visual content.
Assets
Visme has over millions of high-quality assets such as:
- Animated Text – Lets you add three animated text effects to your Visme projects
- Text Widgets – Lots of premade widgets with text and graphics
- Free Images – Adds tons of free searchable images to add to your presentations and infographics
- Vector Icons – Categorized shapes and icons to make your design stand out from the crowd.
These objects/assets are a base for creating a great presentation or infographic, and Visme has it all for you to use.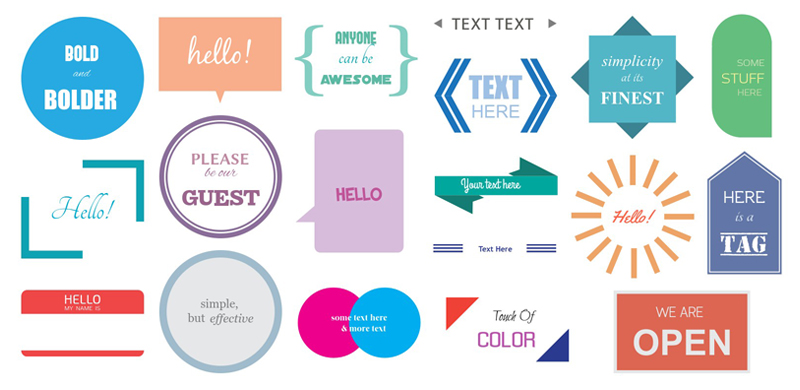
Templates
Visme has a lot of professionally designed templates to start your infographic or presentation, without the need for being a graphic designer.
You can find any great looking template for any niche. And you can edit it with ease.
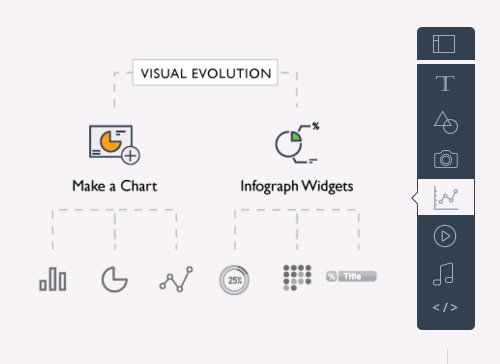
Data to Charts & Graphs
Easily turn your data into a chart or graph that is much easier to understand (e.g in an infographic or presentation).
And all of the charts are animated too (but you can turn it off by default)!
You can even import data from spreadsheets. All you must do is copy all the data you want from your spreadsheet, and paste it straight into Visme. Then it will create a dynamic chart/graph for you.
Animation
Go the extra mile with your project, and use Visme’s built-in animation tool to create mind-blowing presentations (or animated infographics).
The Visme animation engine is very intuitive, and nearly any object can be animated in the space of a few seconds!
All you must do is:
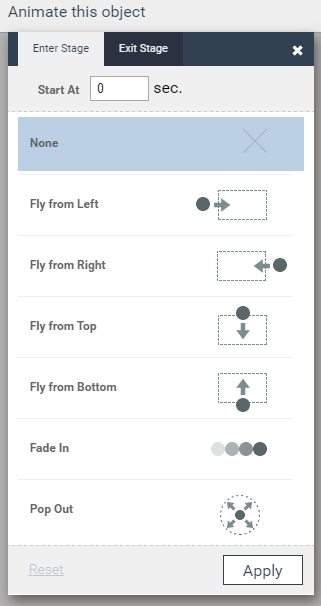
- Select the object you want to animate (by clicking on it)
- Once the object is selected, click the “Animate this object” button.
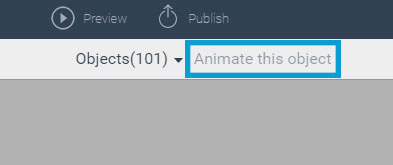
You will then see that you can choose when the object appears/enters, when it disappears/exits, and what effect you would like for each one.
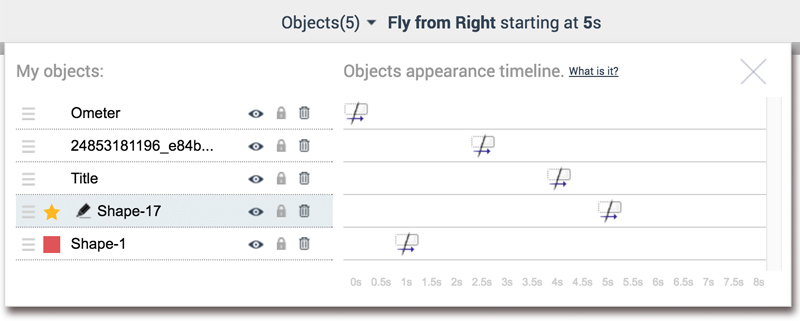
Or you can use the Objects list (next to “Animate this object” button) to control when certain objects appear on the screen in the form of a timeline (these objects include infographic widgets and audio).
 Conclusion
Visme is a great tool with a bunch of great features to create engaging visual content without a lot of effort (since it offers so many templates for you to use).
And to make it even better, there is a free plan!
But you can upgrade to a paid plan to get more great features (that don’t come with the free version).
And it’s quite affordable too, starting from only $7.00 a month with very desirable extras for creating presentations and infographics.
If you’re interested, you can check out Visme’s pricing page.
Or you if you’d like to try Visme first, you can try Visme now for free (it’s a free plan, so you there isn’t a 30 day trial – free forever)!
I’d love to hear what you think about this tool, so make sure to check it out. 😉
I hope you enjoyed this review. Please leave your feedback in the comments, I’ll make sure I’ll respond to any questions or answers.
Thank you for reading! 🙂
